
Many real estate investors leave accelerated depreciation on the table. They accept default depreciation schedules without checking whether their properties qualify for acceleration. County assessor records offer a free, immediate way to screen properties for cost segregation potential before you spend a dollar on a professional study.
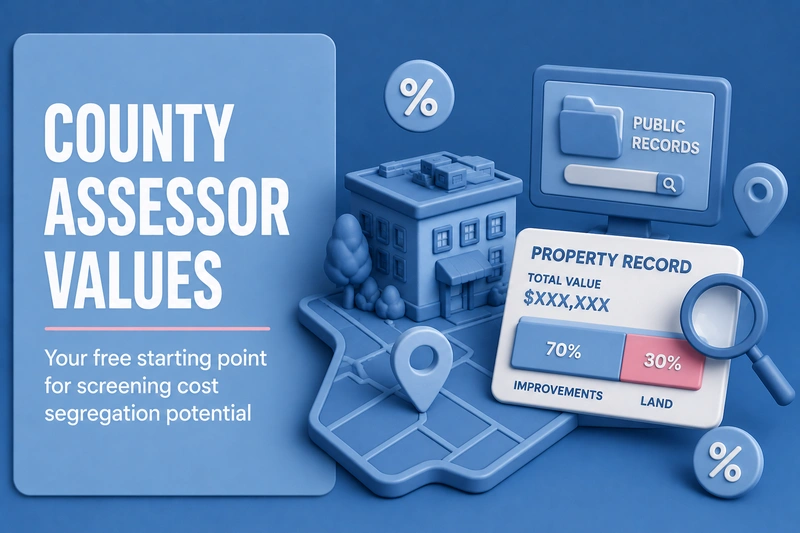
These public records reveal a critical data point: how much of your property's value sits in land versus improvements. The IRS lets you depreciate only improvements, so this ratio tells you whether a property is worth investigating further.
This guide shows you how to access assessor databases, interpret the data, and prioritize cost segregation studies. Whether you're evaluating acquisition targets or reviewing your existing portfolio, assessor data gives you a starting point for smarter tax planning.
Why County Assessor Data Matters for Cost Segregation
Every county assessor's office maintains property records that separate total assessed value into two categories: land and improvements. Related: why land value matters in cost segregation. This split matters because the IRS allows depreciation only on improvements. Land value is never depreciable (IRS Publication 946).
Assessor values are not a substitute for an engineering-based cost segregation study, which produces the audit-ready 5-, 7-, and 15-year component detail you rely on at filing. The IRS does, however, accept the property tax assessor's values as one reasonable way to compute the land-to-building ratio when you split your purchase price (IRS depreciation FAQs). As a screening tool, that ratio is powerful. A property showing roughly 75% of its value in improvements tends to signal strong cost segregation potential. A property with only 40% in improvements typically yields lower returns on study investment. Treat these figures as screening heuristics, not bright-line rules.
The strategic advantage is speed. You can screen a batch of properties in the time it would take to underwrite a single one by hand. This lets you evaluate acquisition targets quickly or surface overlooked opportunities in your existing portfolio.
Example: An investor evaluating a $2.4 million multifamily property pulls the assessor record. It shows $600,000 allocated to land and $1.8 million to improvements, a 75% improvement ratio, which points to a strong candidate. If 25% of the $1.8 million improvement value qualifies for acceleration, that's $450,000 in potential first-year deductions, subject to the timing, passive-loss, and recapture rules covered below.
Understanding Land vs. Improvement Allocations
Assessors use several methods to determine these values, including comparable sales, replacement cost estimates, and income analysis. The specific method matters less than the resulting ratio.
Regional variations affect these ratios significantly. Coastal markets often show higher land percentages because of premium lot values. Industrial properties in secondary markets may show 85% or more allocated to improvements.
When you review assessor data, focus on these key elements:
- Improvement percentage: Higher ratios mean more depreciable basis.
- Building square footage: Larger buildings typically hold more acceleratable components.
- Year built: Newer construction often contains more qualifying assets.
- Property classification: Commercial, industrial, and multifamily properties each carry different acceleration profiles.
Can I just use the assessor's land/building split for my tax return?
You can use the assessor's ratio to allocate your purchase price between land and building, and the IRS recognizes that as a reasonable method (IRS depreciation FAQs). What the assessor record can't give you is the engineering-based breakout of 5-, 7-, and 15-year components — that comes from a professional study, which also provides the documentation that supports your accelerated deductions.
Accessing Assessor Databases State-by-State
Most counties now offer free online property search portals. Data depth varies significantly by jurisdiction. Some provide detailed breakdowns with improvement histories. Others show only basic assessed values.
The table below is a general orientation to online assessor access in several high-investor-activity states as of mid-2026. Portal features change, so confirm details with the county before relying on them.
| State | Online Access | Data Included | Notes |
| Texas | Yes | Land/building split, sq ft, year built | Data is held by county appraisal districts on separate sites |
| Florida | Yes | Detailed breakdowns, sales history | Most counties offer strong portals |
| California | Partial | Varies by county | Some counties require in-person requests |
| Arizona | Yes | Good detail in most counties | Maricopa County is especially comprehensive |
| Tennessee | Yes | Basic to moderate detail | Nashville/Davidson County has strong data |
| Georgia | Yes | Moderate detail | Fulton County offers solid commercial data |
| North Carolina | Yes | Varies significantly | Wake County keeps detailed records |
| Ohio | Yes | Good statewide coverage | County auditor sites are well organized |
| Indiana | Yes | Moderate detail | Most counties are searchable online |
| Nevada | Yes | Good detail | Clark County (Las Vegas) is comprehensive |
When online data is incomplete, you have options. Request assessment cards directly from the county office. These detailed records often contain information the online portal omits. Third-party data aggregators can fill gaps, though they usually require paid subscriptions.
Interpreting the Data: What the Numbers Tell You
Raw assessor data requires interpretation. Follow this process to extract useful insights:
- Compare total assessed value to purchase price. Assessments often lag market values. A property purchased for $3 million may show an assessed value of $2.5 million. This is normal.
- Calculate the improvement ratio. Divide improvement value by total assessed value. A property assessed at $2.5 million with $2 million in improvements has an 80% improvement ratio.
- Note building age and major improvement dates. Property placed in service after 1986 (1987 onward) falls under MACRS and can qualify for cost segregation (IRS Cost Segregation Audit Techniques Guide). Recent improvements may qualify for bonus depreciation.
- Review property use classification. Industrial and hospitality properties often yield higher acceleration percentages than standard office buildings.
Example: A 2015-built flex industrial building purchased for $3.2 million shows an assessed value of $2.9 million. The assessor allocates $400,000 to land and $2.5 million to improvements, an 86% improvement ratio.
With modern construction and a high improvement allocation, this property is a strong cost segregation candidate. In our studies, industrial properties commonly reclassify 30–35% of improvement basis, though the actual result depends entirely on the specific asset mix. If a study identified 32% of the $2.5 million improvement value, $800,000, as 5-, 7-, and 15-year property, and 100% bonus depreciation applied, the investor could claim $800,000 in first-year deductions. At the top 37% marginal rate, that's roughly $296,000 in tax savings, before applying the passive-loss and recapture rules discussed below.
What if the assessed value is much lower than what I paid?
Assessments often lag market values by several years. Focus on the ratio of land to improvements, not the absolute numbers. If an assessor shows 20% land and 80% improvements, that proportional split still provides useful screening information. The total does not need to match your purchase price for the ratio to be helpful.
What the First-Year Numbers Don't Show
The headline deduction is only part of the picture. Four conditions determine what a study actually delivers.
- Bonus depreciation timing. Under the One Big Beautiful Bill Act (OBBBA), 100% bonus depreciation is permanent for qualified property acquired and placed in service after January 19, 2025 (IRS Notice 2026-11). Property acquired under a written binding contract before January 20, 2025 remains on the old phase-down schedule: 40% for a 2025 placed-in-service year and 20% for 2026. Assets already placed in service in 2023 or 2024 are locked at 80% and 60% respectively, worth keeping in mind when you screen properties you already own for a look-back study.
- Passive activity loss limits. For many investors these deductions are passive and can only offset passive income unless you qualify as a real estate professional AND materially participate in the rental (or elect to aggregate under Reg. sec. 1.469-9(g)), or meet the short-term rental material-participation rules (IRS Publication 925).
- Depreciation recapture. Accelerating deductions increases the depreciation recaptured as income when you sell, so the timing of a sale matters (IRS Publication 544).
- State conformity. Many states do not conform to federal bonus depreciation, so your state tax result can differ from the federal figures shown here.
Red Flags and Limitations of Assessor Data
Assessor data is a screening tool, not a definitive analysis. Several situations reduce its reliability.
Common pitfalls:
- Recent renovations not captured: Assessors may not have recorded tenant improvements or recent upgrades.
- Agricultural exemptions: Some jurisdictions assess land at artificially low values for tax purposes.
- Multi-parcel properties: Combined assessments can obscure individual building values.
- Obsolete classifications: Property use may have changed since the last assessment.
When assessor data is not reliable:
- Properties with significant deferred maintenance
- Mixed-use buildings with complex allocations
- After a 1031 exchange, your depreciable basis is usually far lower than the price you paid, screen against carryover basis, not the purchase price.
- Properties with major unreported improvements
In these situations, professional analysis becomes essential. An engineering-based study with site visits captures details that assessor records miss.
Does this work for properties I've owned for years?
In most cases, yes. Assessor records help you identify overlooked cost segregation opportunities in a portfolio you already hold. If you've been using straight-line depreciation, you can claim missed accelerated depreciation through a look-back study. Your CPA files Form 3115 to request the accounting-method change and capture the missed depreciation as a one-time Section 481(a) adjustment, without amending prior returns (About IRS Form 3115).
Turning Assessor Insights Into Action
Use assessor data to prioritize your cost segregation investments. Not every property justifies a professional study. Focus your resources where returns are highest.
Strong candidates (investigate first):
- 70%+ improvement ratio
- Building constructed or renovated in 1987 or later
- Purchase price above $500,000
- Property types with high personal property content (hotels, medical, restaurants)
Worth investigating:
- 50–70% improvement ratio
- Significant tenant build-outs
- Recent capital improvements
- Short-term rentals where the owner materially participates
Lower priority:
- High land ratio (50%+ land)
- Older buildings with limited remaining basis
- Properties with minimal improvements
Comparison Example: An investor owns two properties, each purchased for $1.8 million.
Property A: The assessor shows 80% improvements ($1.44 million depreciable basis). A study might identify $430,000 in acceleratable components. With 100% bonus depreciation at the top 37% rate, that's roughly $159,000 in Year 1 tax savings, before passive-loss and recapture rules.
Property B: The assessor shows 45% improvements ($810,000 depreciable basis). The same analysis might identify only $240,000 in acceleratable components. Year 1 tax savings: roughly $89,000 on the same basis of assumptions.
The study fee is similar for both properties, yet Property A delivers nearly double the return. Assessor data helped the investor prioritize correctly.
Build a simple tracking spreadsheet for your portfolio. Record property address, purchase price, assessed value, land allocation, improvement allocation, and improvement percentage. This lets you compare holdings quickly and identify which properties warrant professional analysis.
Key Takeaways
County assessor records provide a free, fast way to screen properties for cost segregation potential. Here's what to remember:
- Assessor data is a screening tool, not the final tax document. Use it to prioritize, not to file; the engineering-based study provides the 5-, 7-, and 15-year detail.
- Focus on the improvement ratio. Higher improvement percentages indicate stronger cost segregation candidates.
- Database accessibility varies by state. Texas, Florida, and Arizona generally offer solid online access; other states may require direct requests.
- Assessor values often lag market prices. The ratio matters more than the absolute values.
- Both new acquisitions and existing holdings can benefit. Look-back studies with Form 3115 capture missed depreciation on properties you already own.
- Model the after-tax result, not just the deduction. Bonus timing, passive-loss limits, recapture, and state conformity all shape your actual savings.
Investors who use public records find cost segregation opportunities faster and direct study budgets toward the properties that generate the highest returns.
Want to know which properties in your portfolio justify a study? Request a no-obligation portfolio analysis from R.E. Cost Seg. Our engineering-based studies meet IRS requirements and include full audit support.

.webp)